Projects / Internal tool
TGW Insights
One platform for the maintenance team of an automated fulfilment centre.
All data shown is anonymised. The final software may differ from what is presented here.
TGW Insights is a product of TGW Logistics Group GmbH. © 2026 TGW Logistics Group GmbH. All rights reserved.
- Context
- Internal tool at TGW Logistics
- Year
- 2026
- Role
- Product owner, design, development
- Status
- Shipped
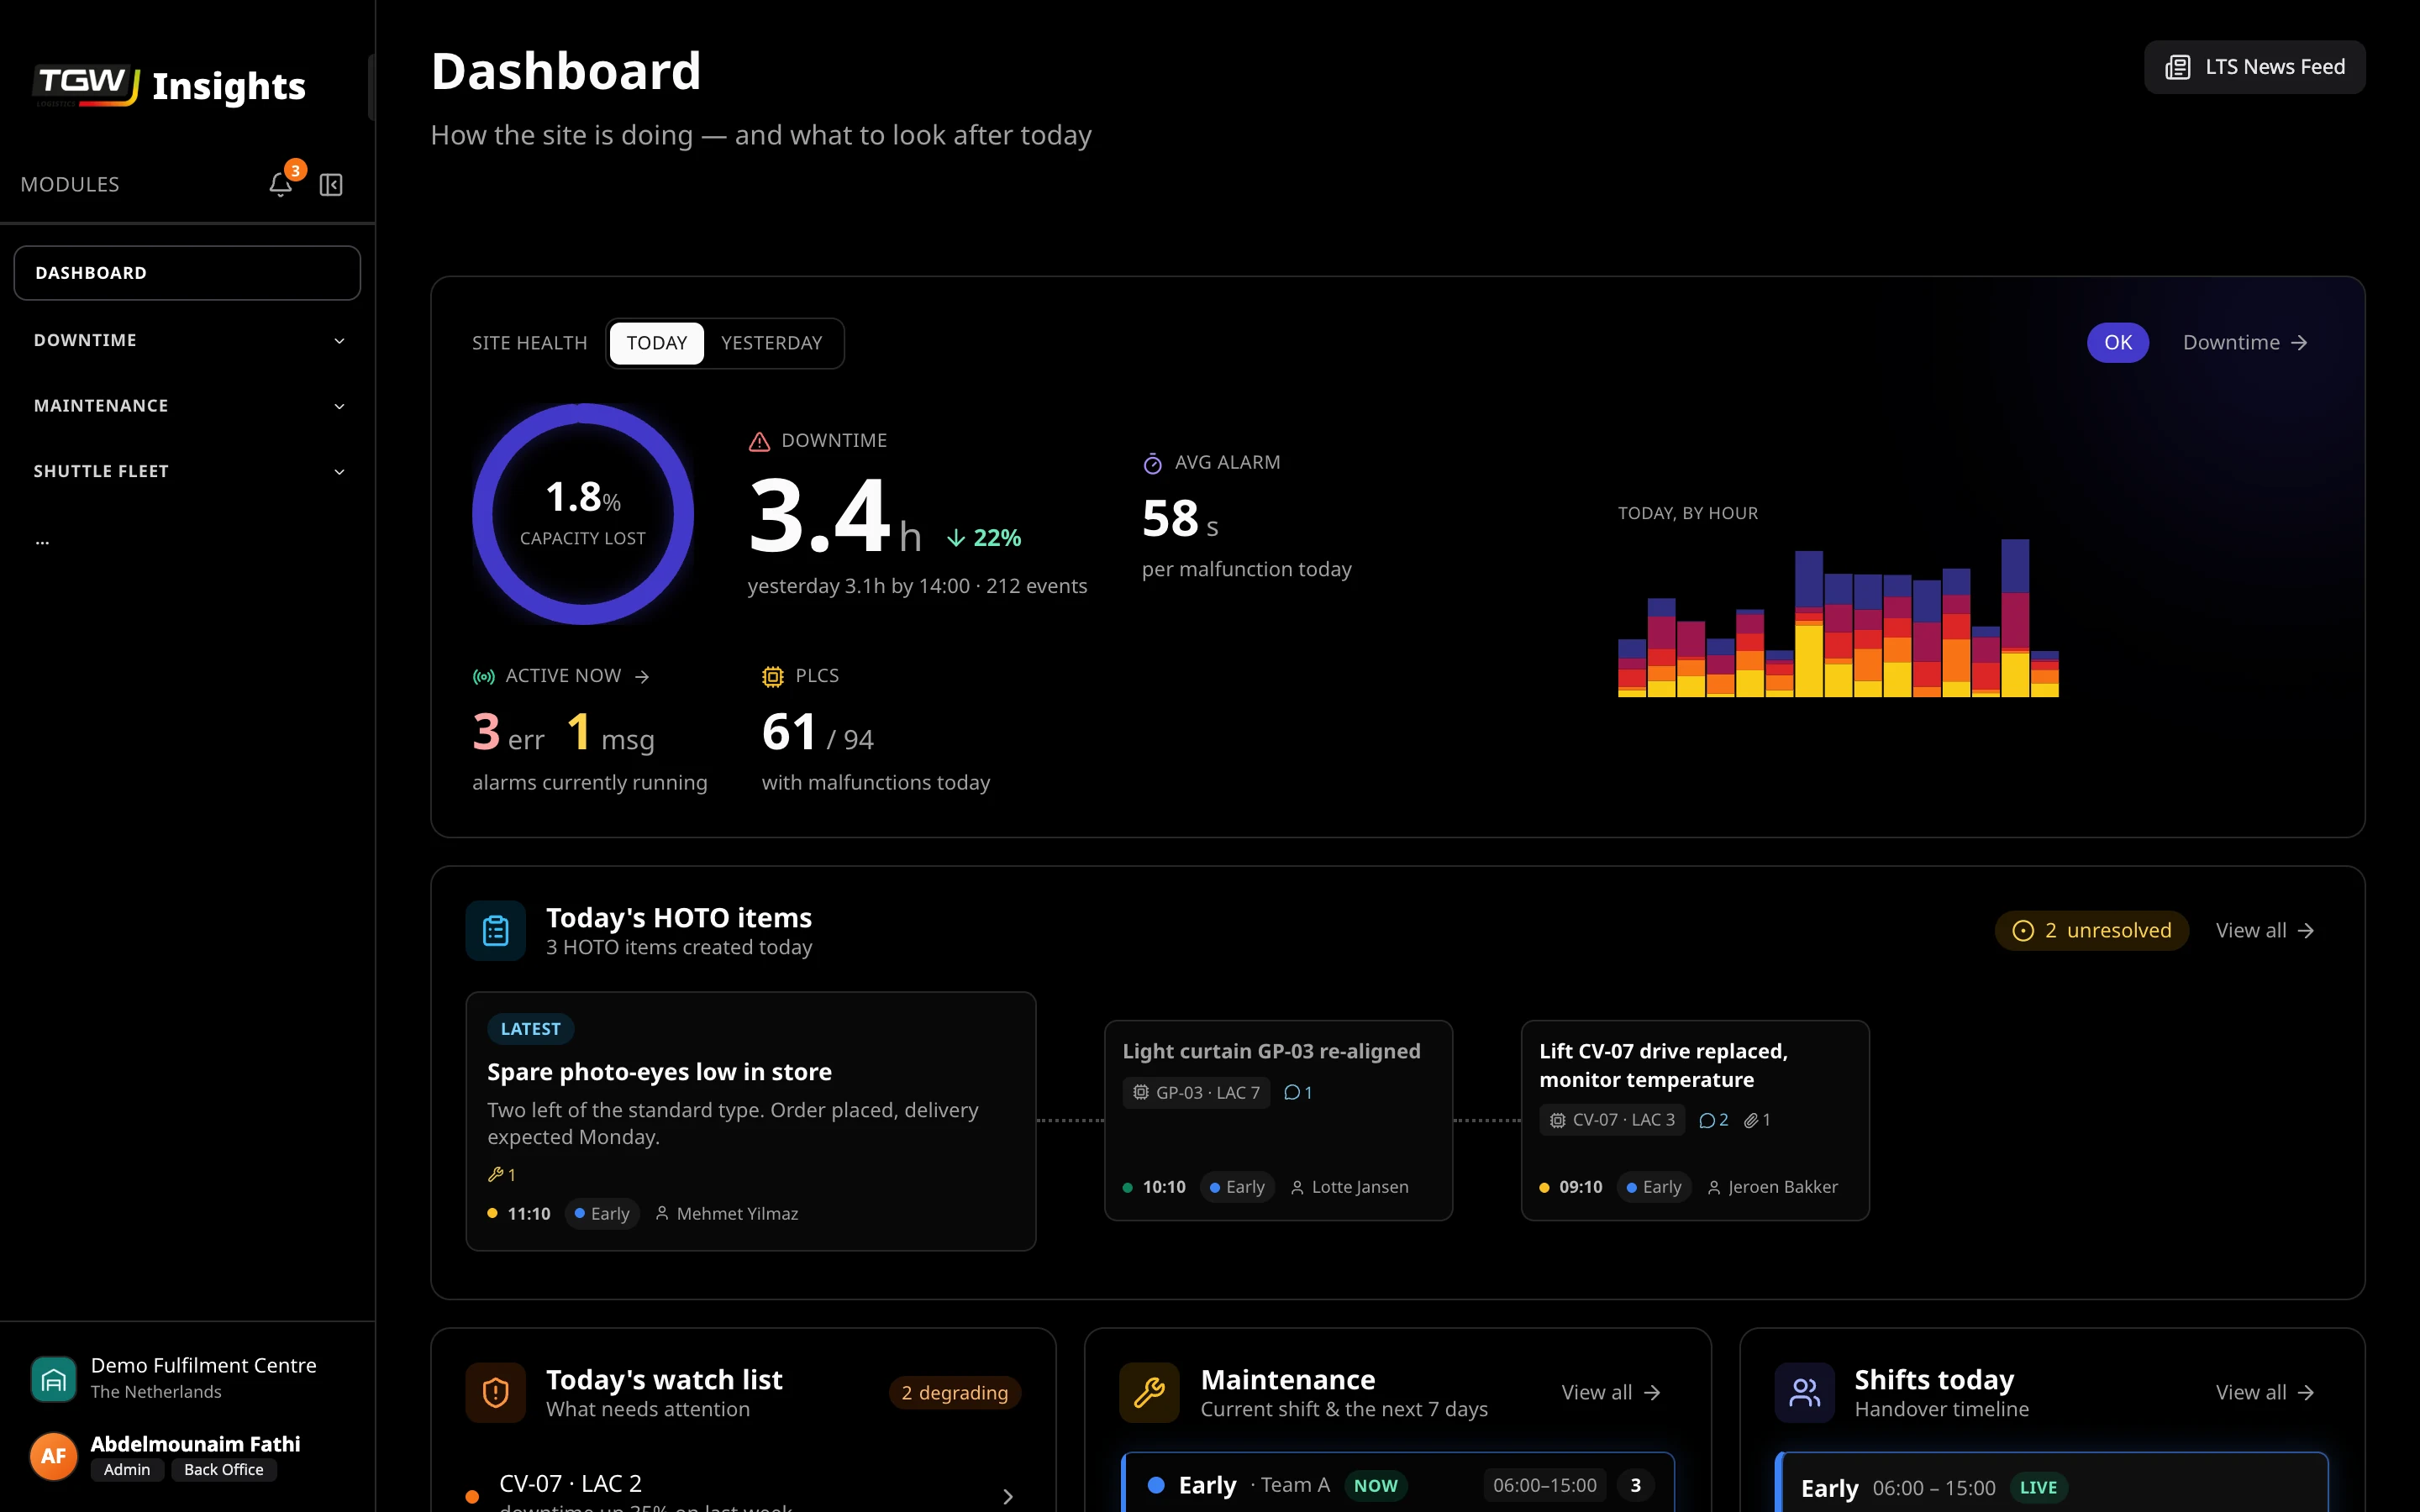
Why
What stopped this area last night, and has it happened before? Answering that took four systems and someone who knew where to look.
Before
Alarms in one system, planned work in another, parts in exports, handovers in notes, and KPIs assembled by hand.
The idea
One place that reads from the systems that already exist, so nobody types anything twice.
Today
Between 60 and 70 people use it every day, from technicians on shift to site management.
What the team gets
From the alarm on the wall to the part on the shelf.
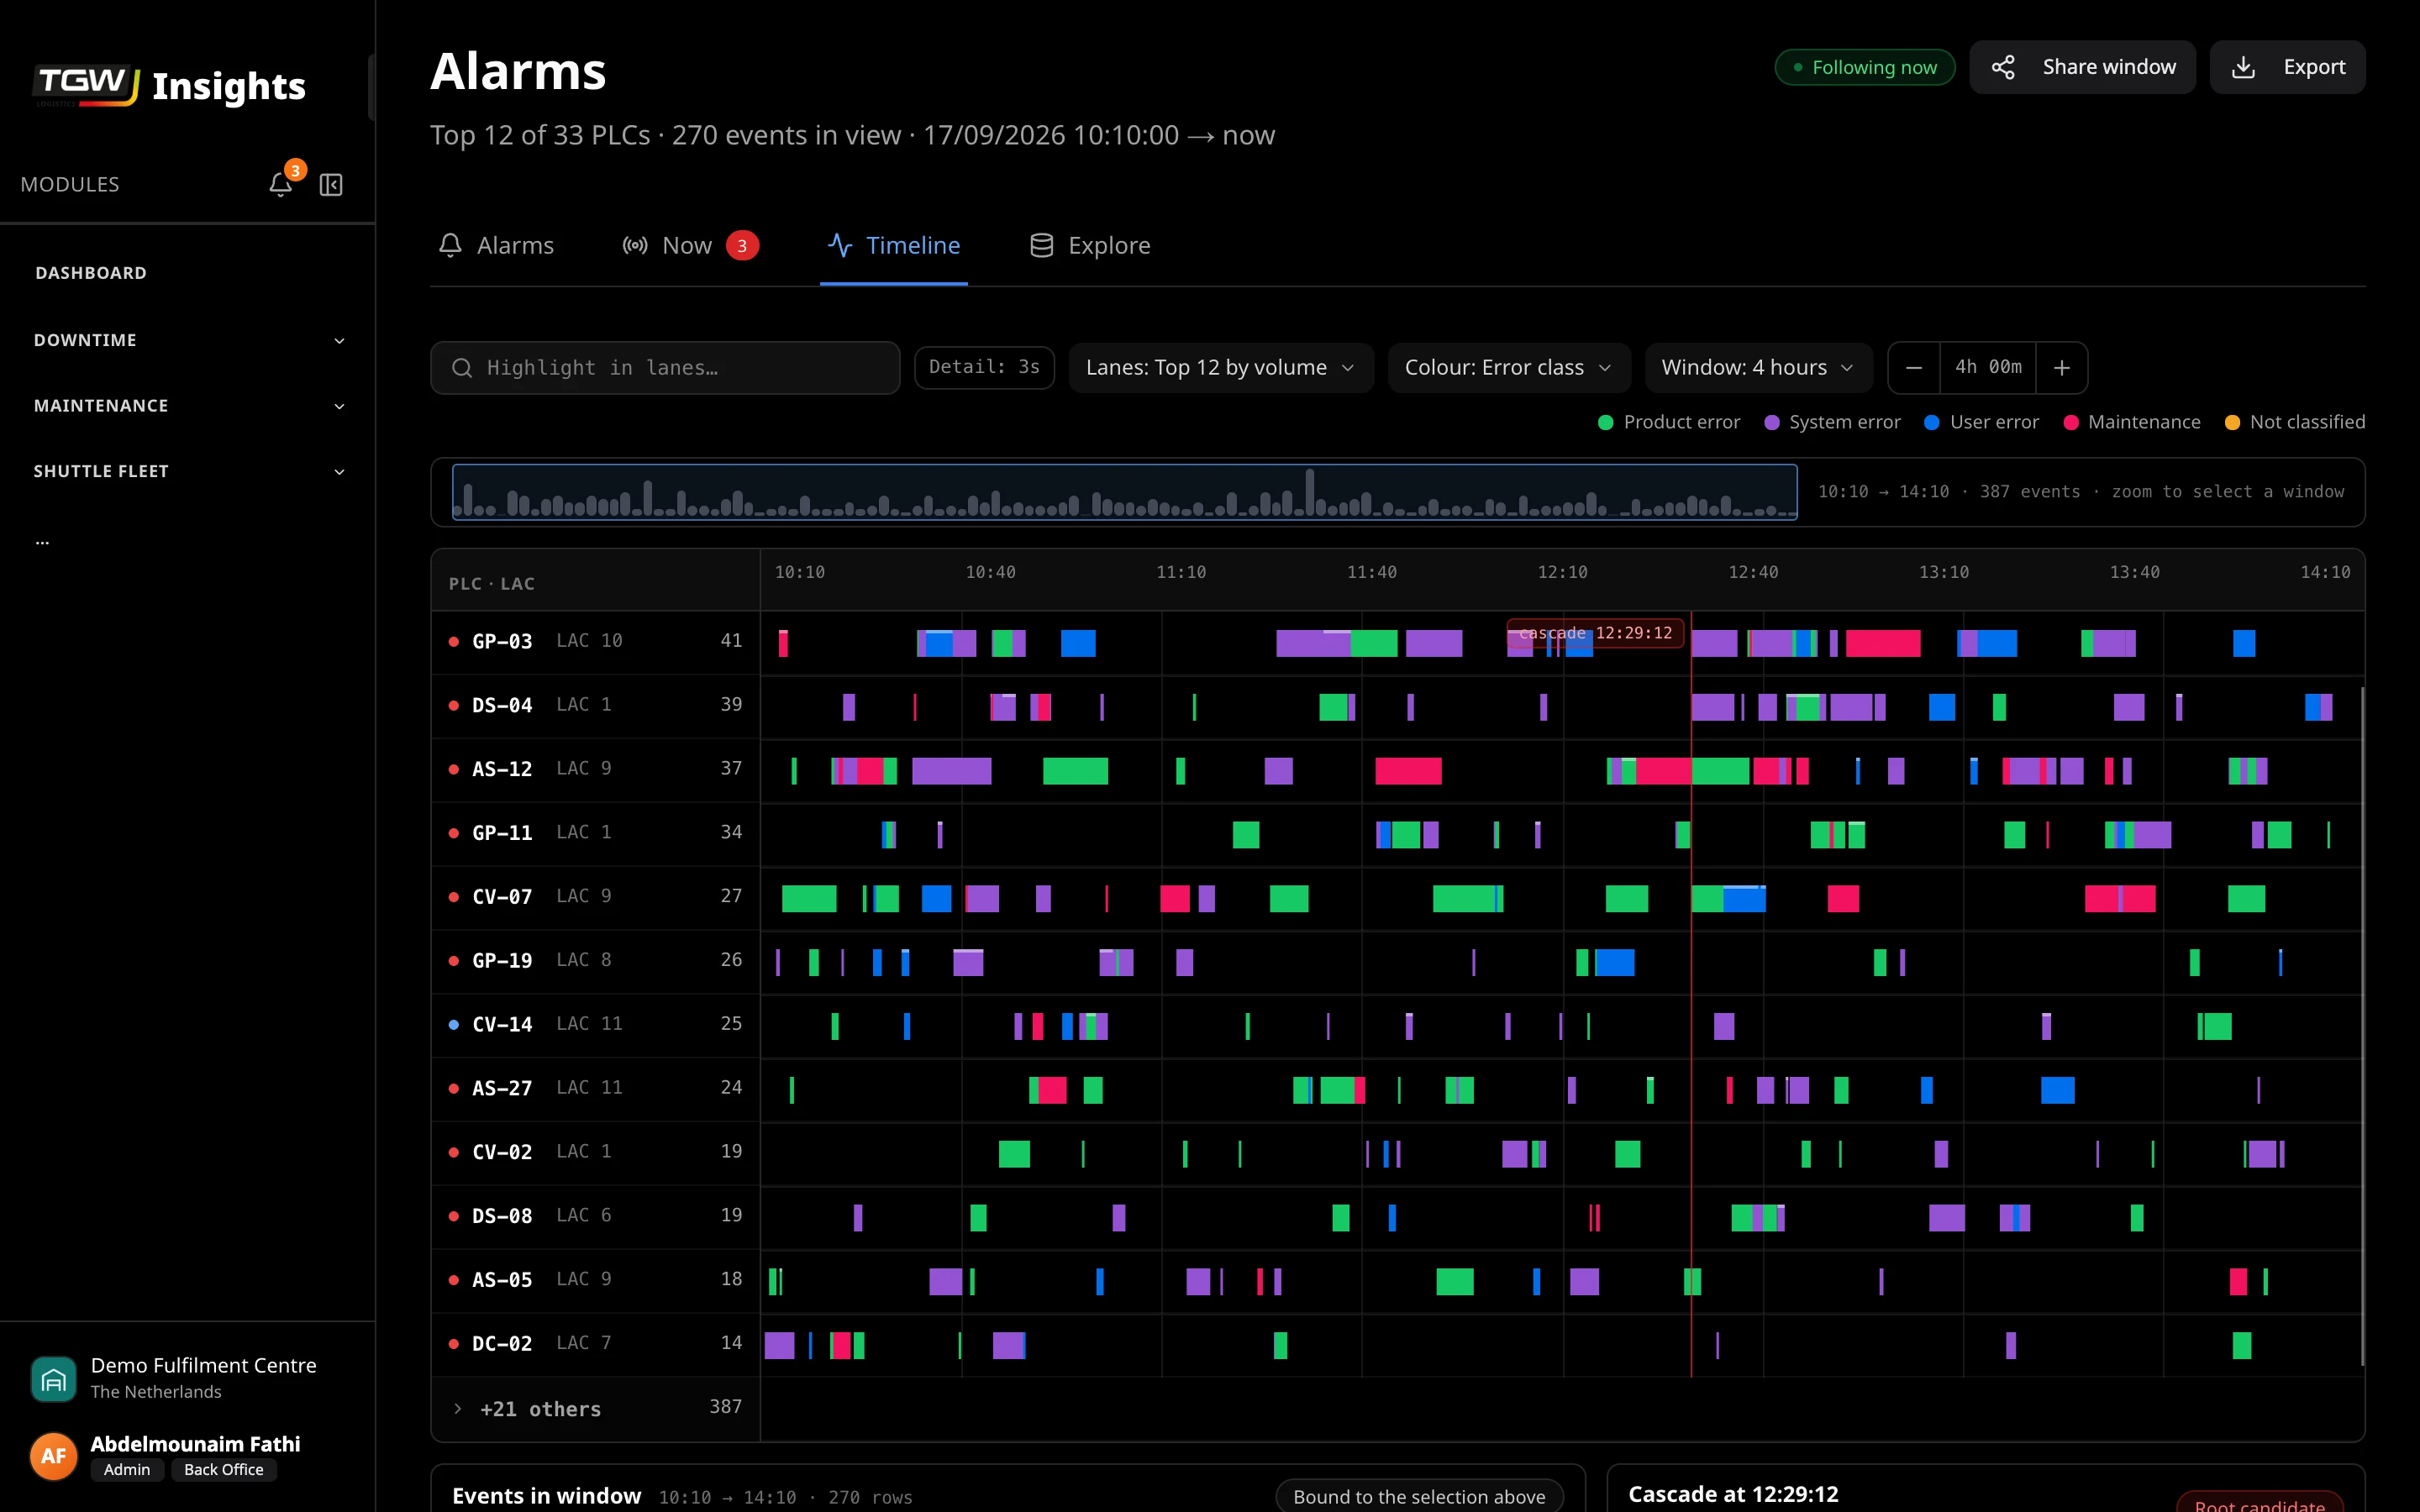
Alarms you can read
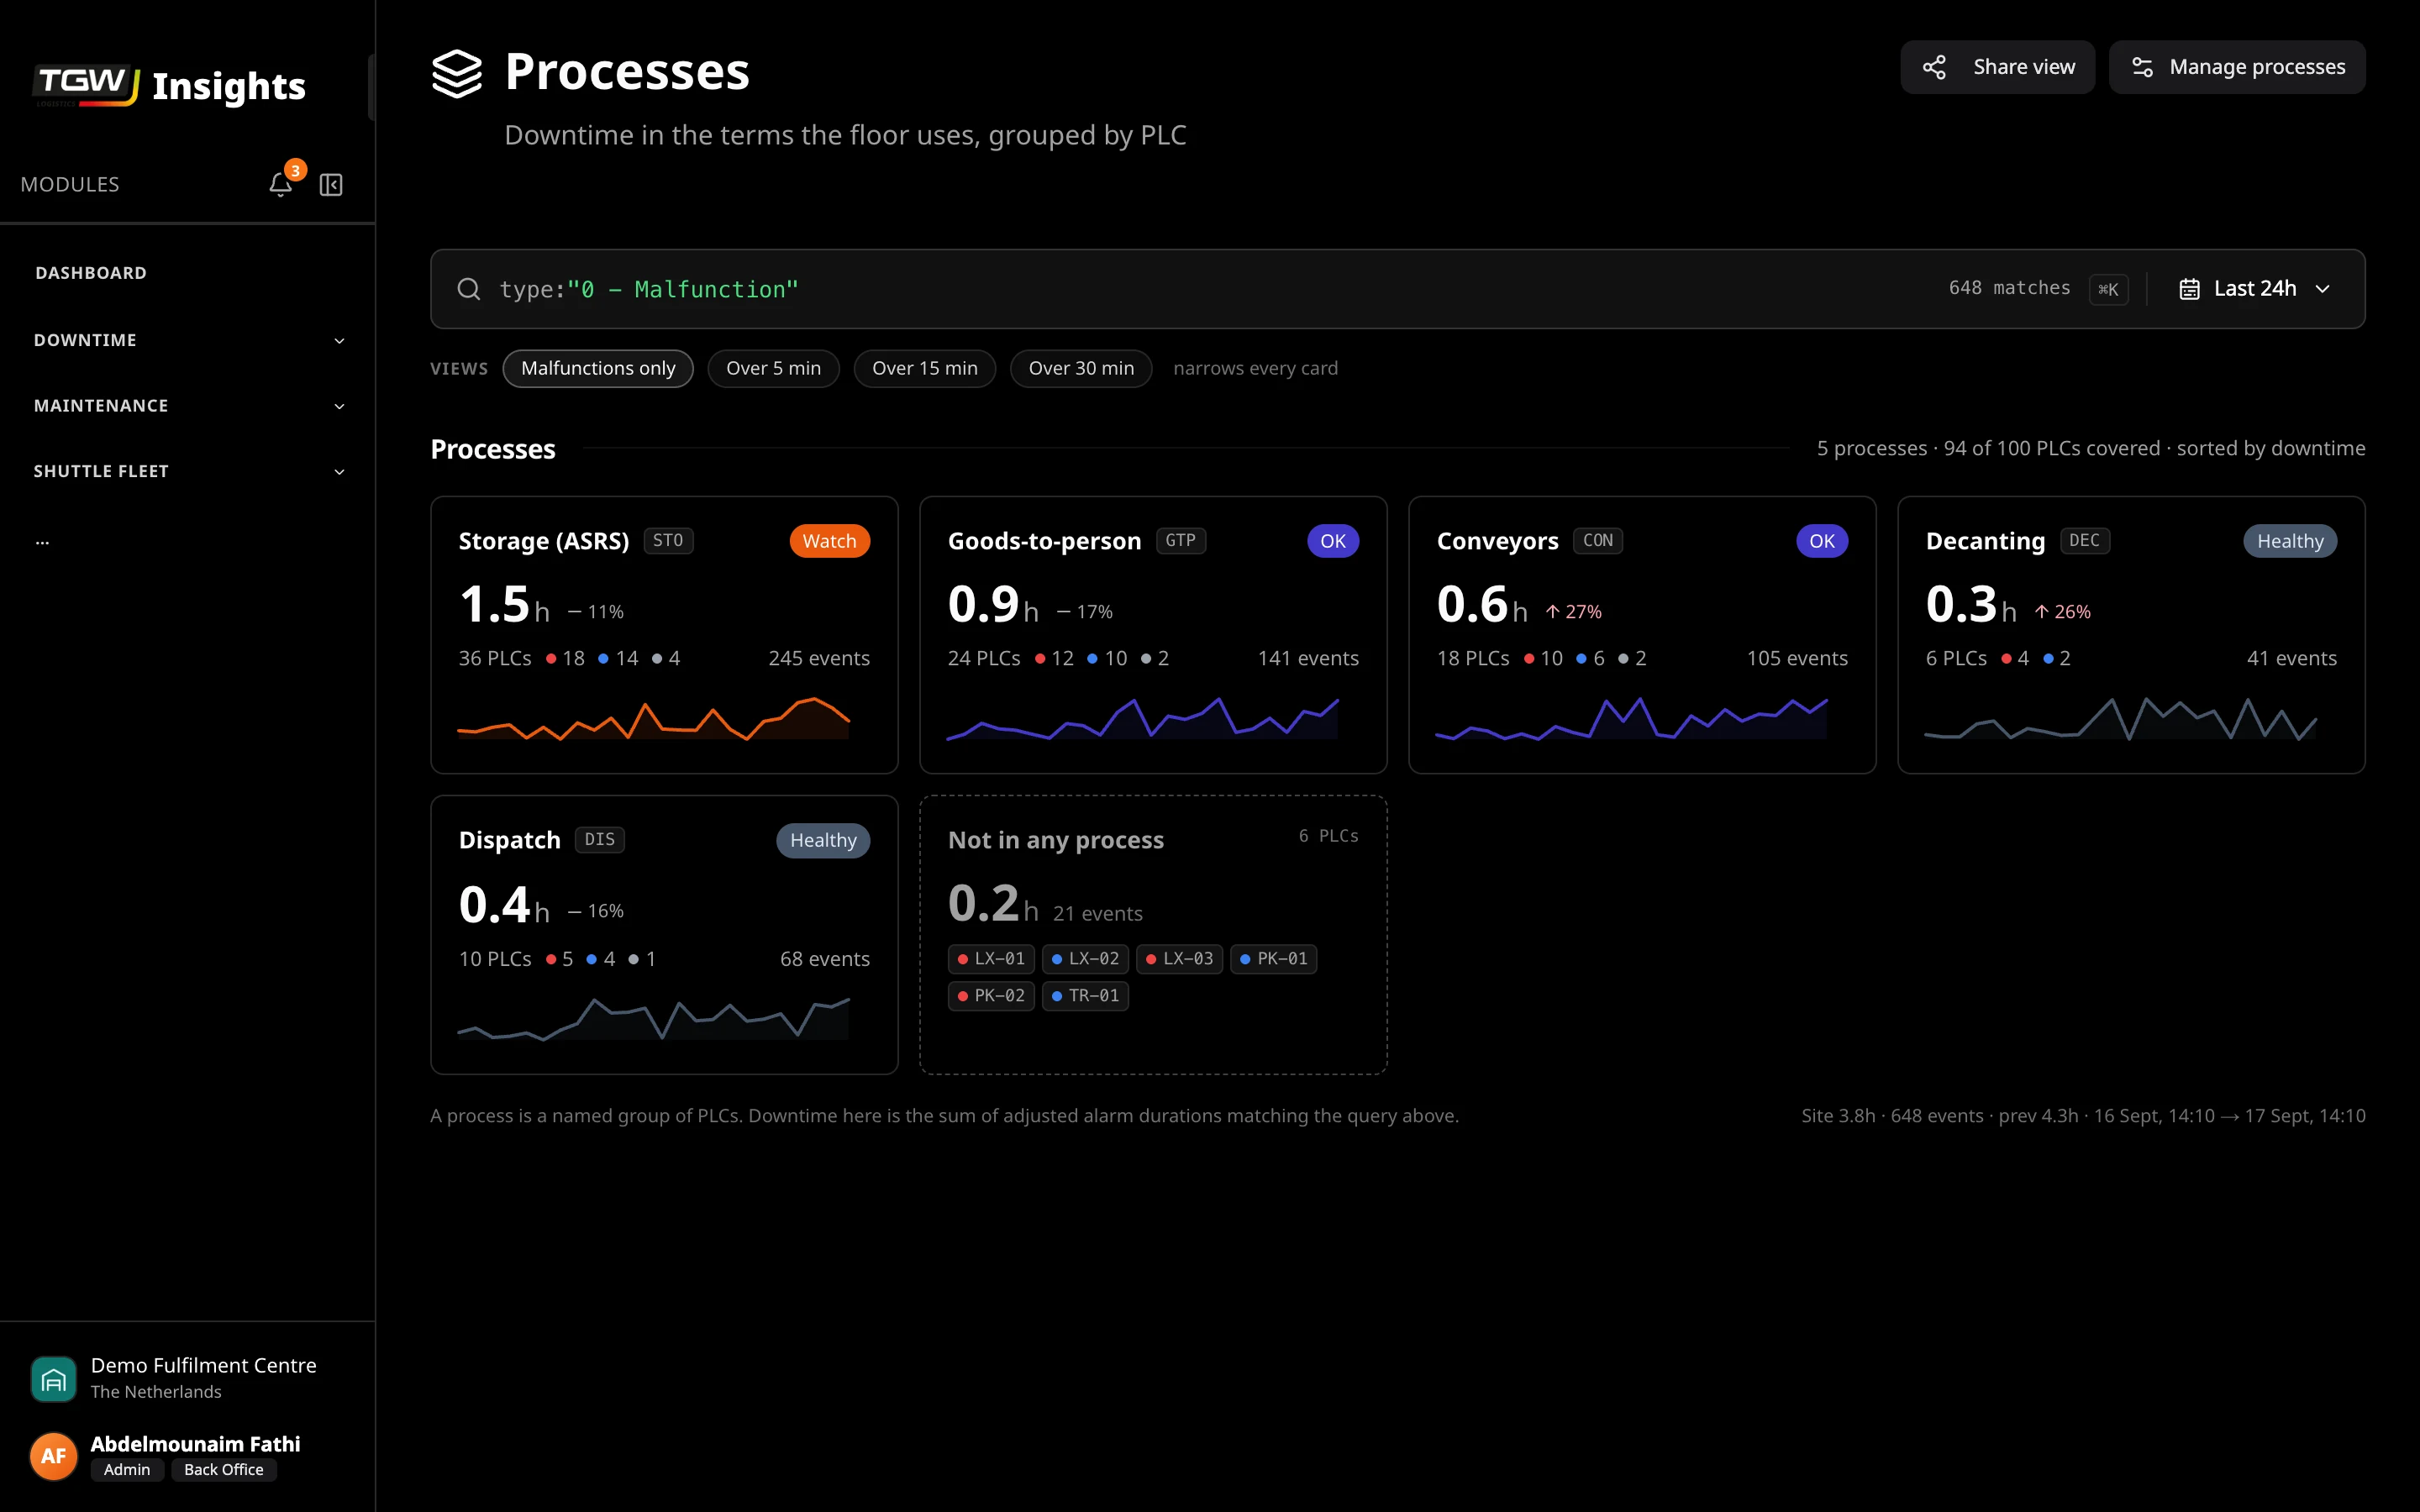
What is standing right now, what happens most, and how one fault cascades into others.
A board for the wall
You can read it from across the workshop, so nobody has to walk over to see how the site is doing.
Downtime and KPIs
The period reports used to be assembled by hand. Now they come out of rules anyone can read.
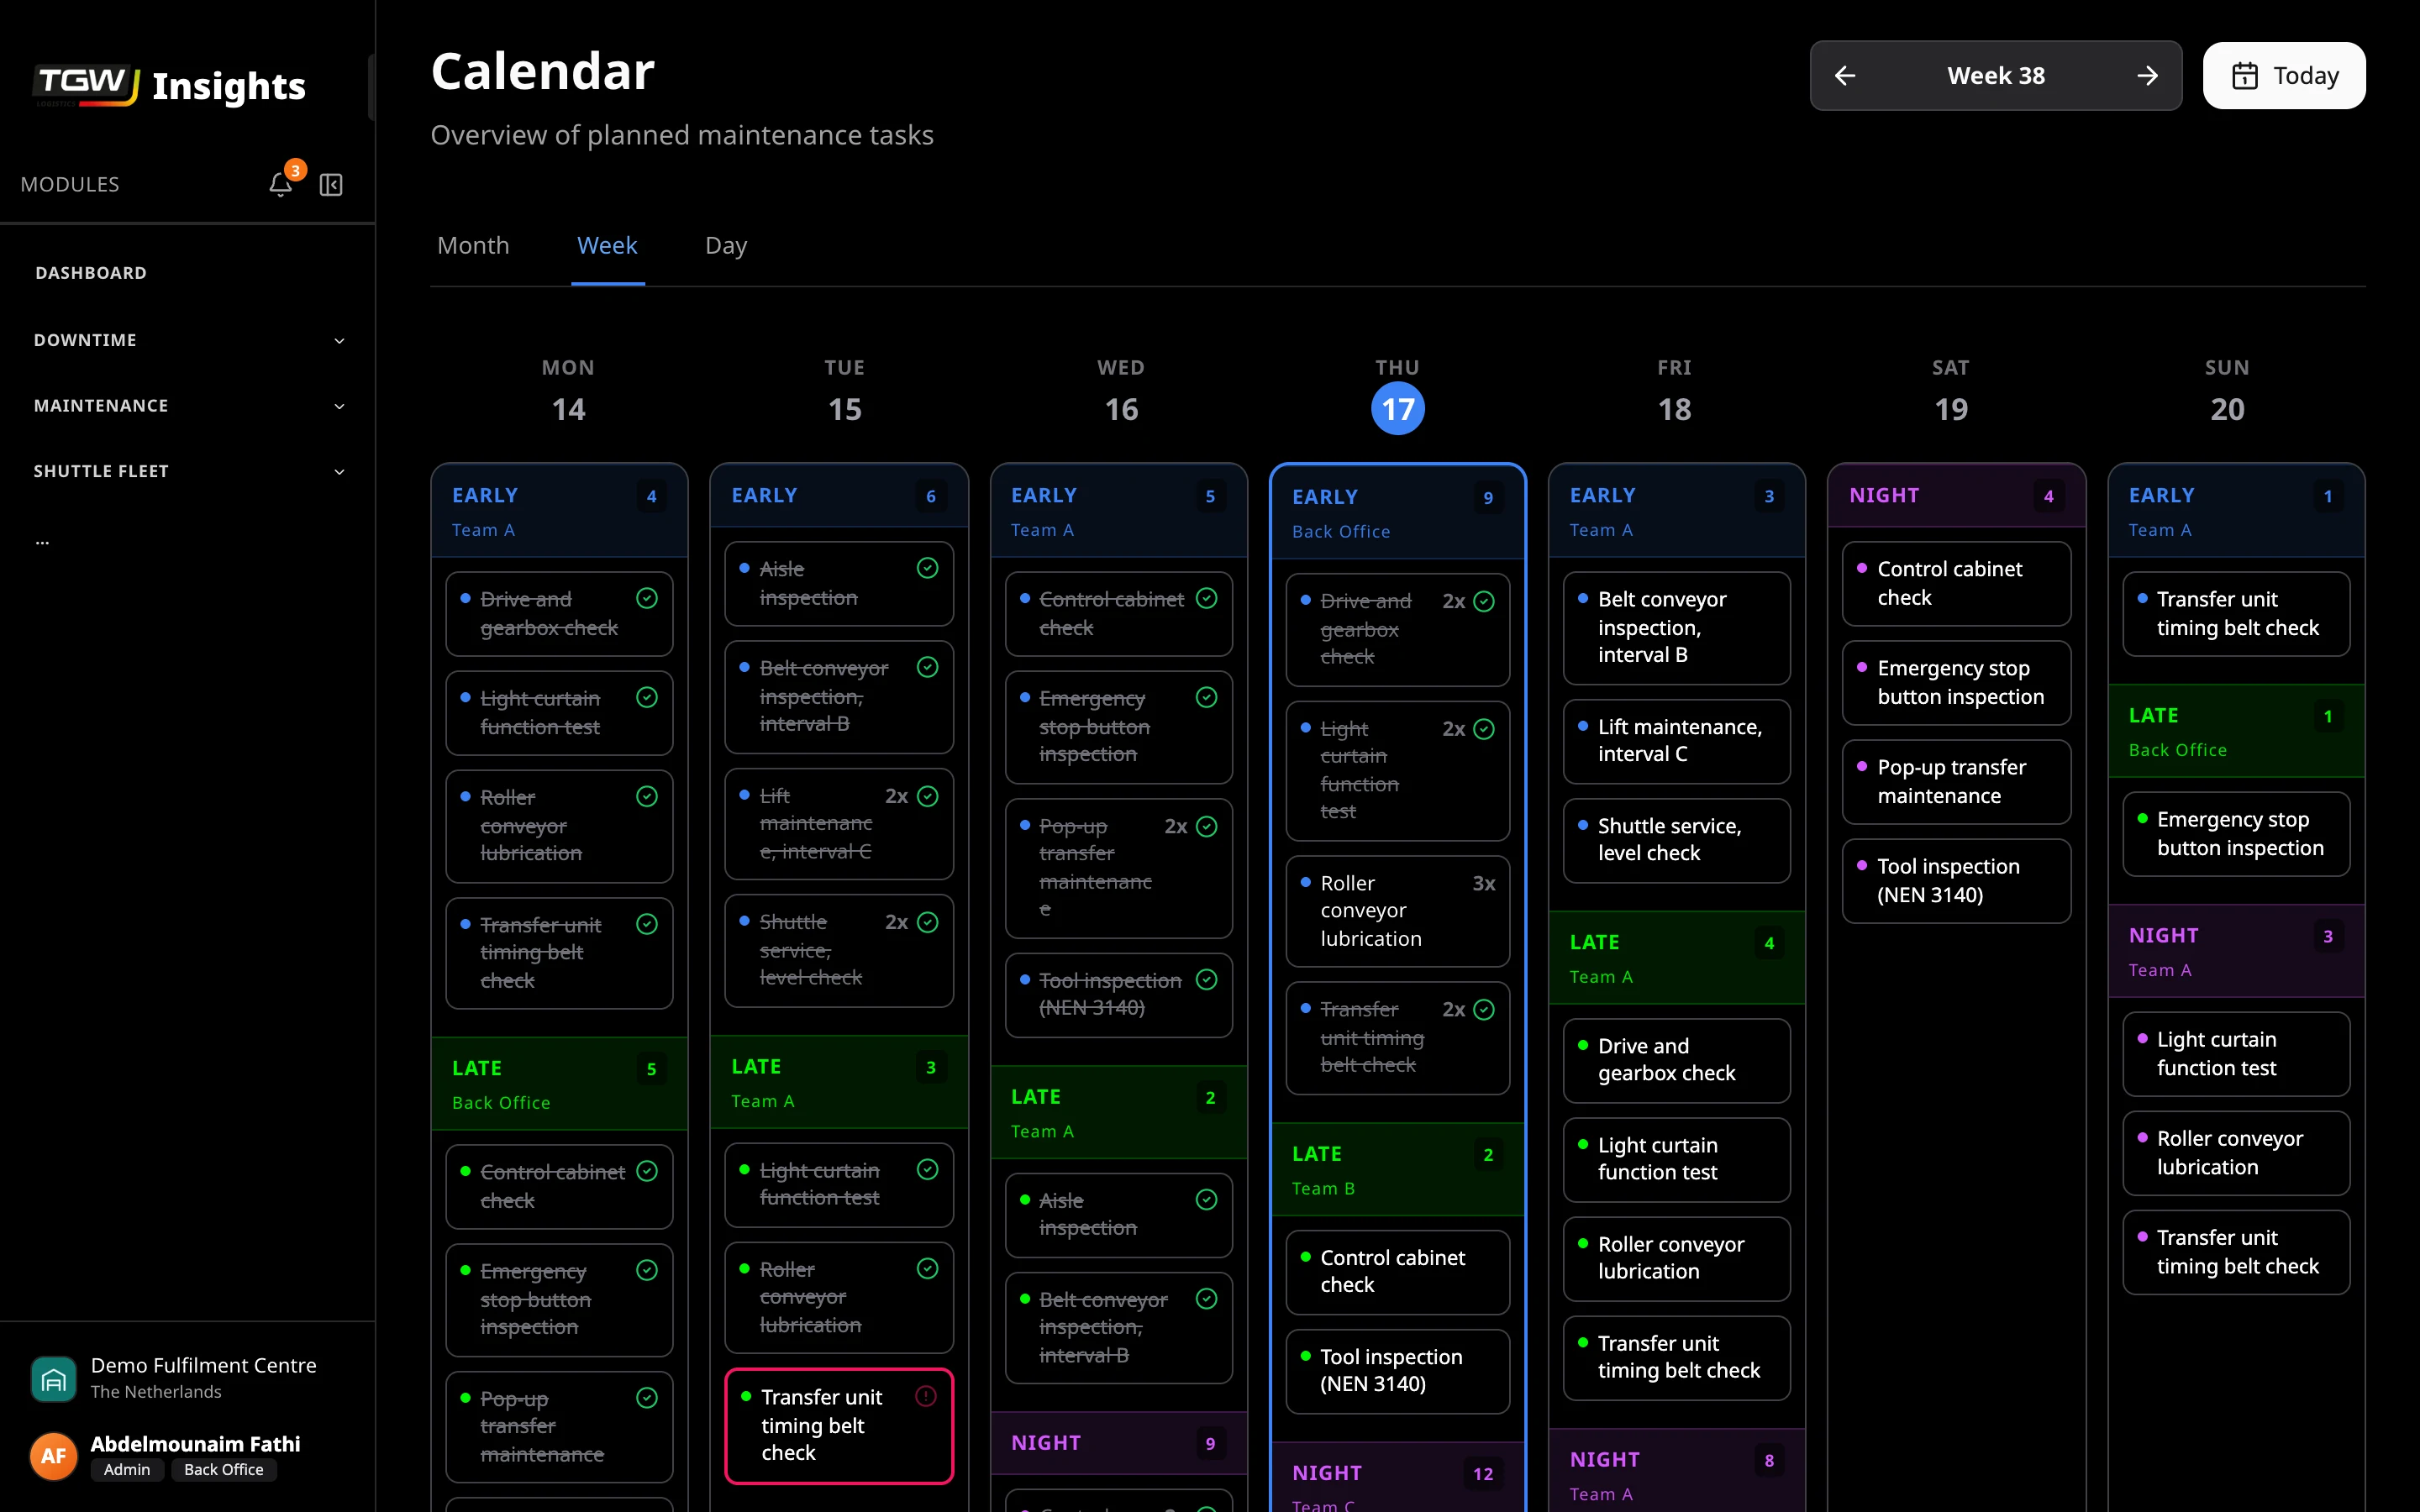
Planning and tasks
A calendar with my tasks and the team's, fed straight from the maintenance management system.
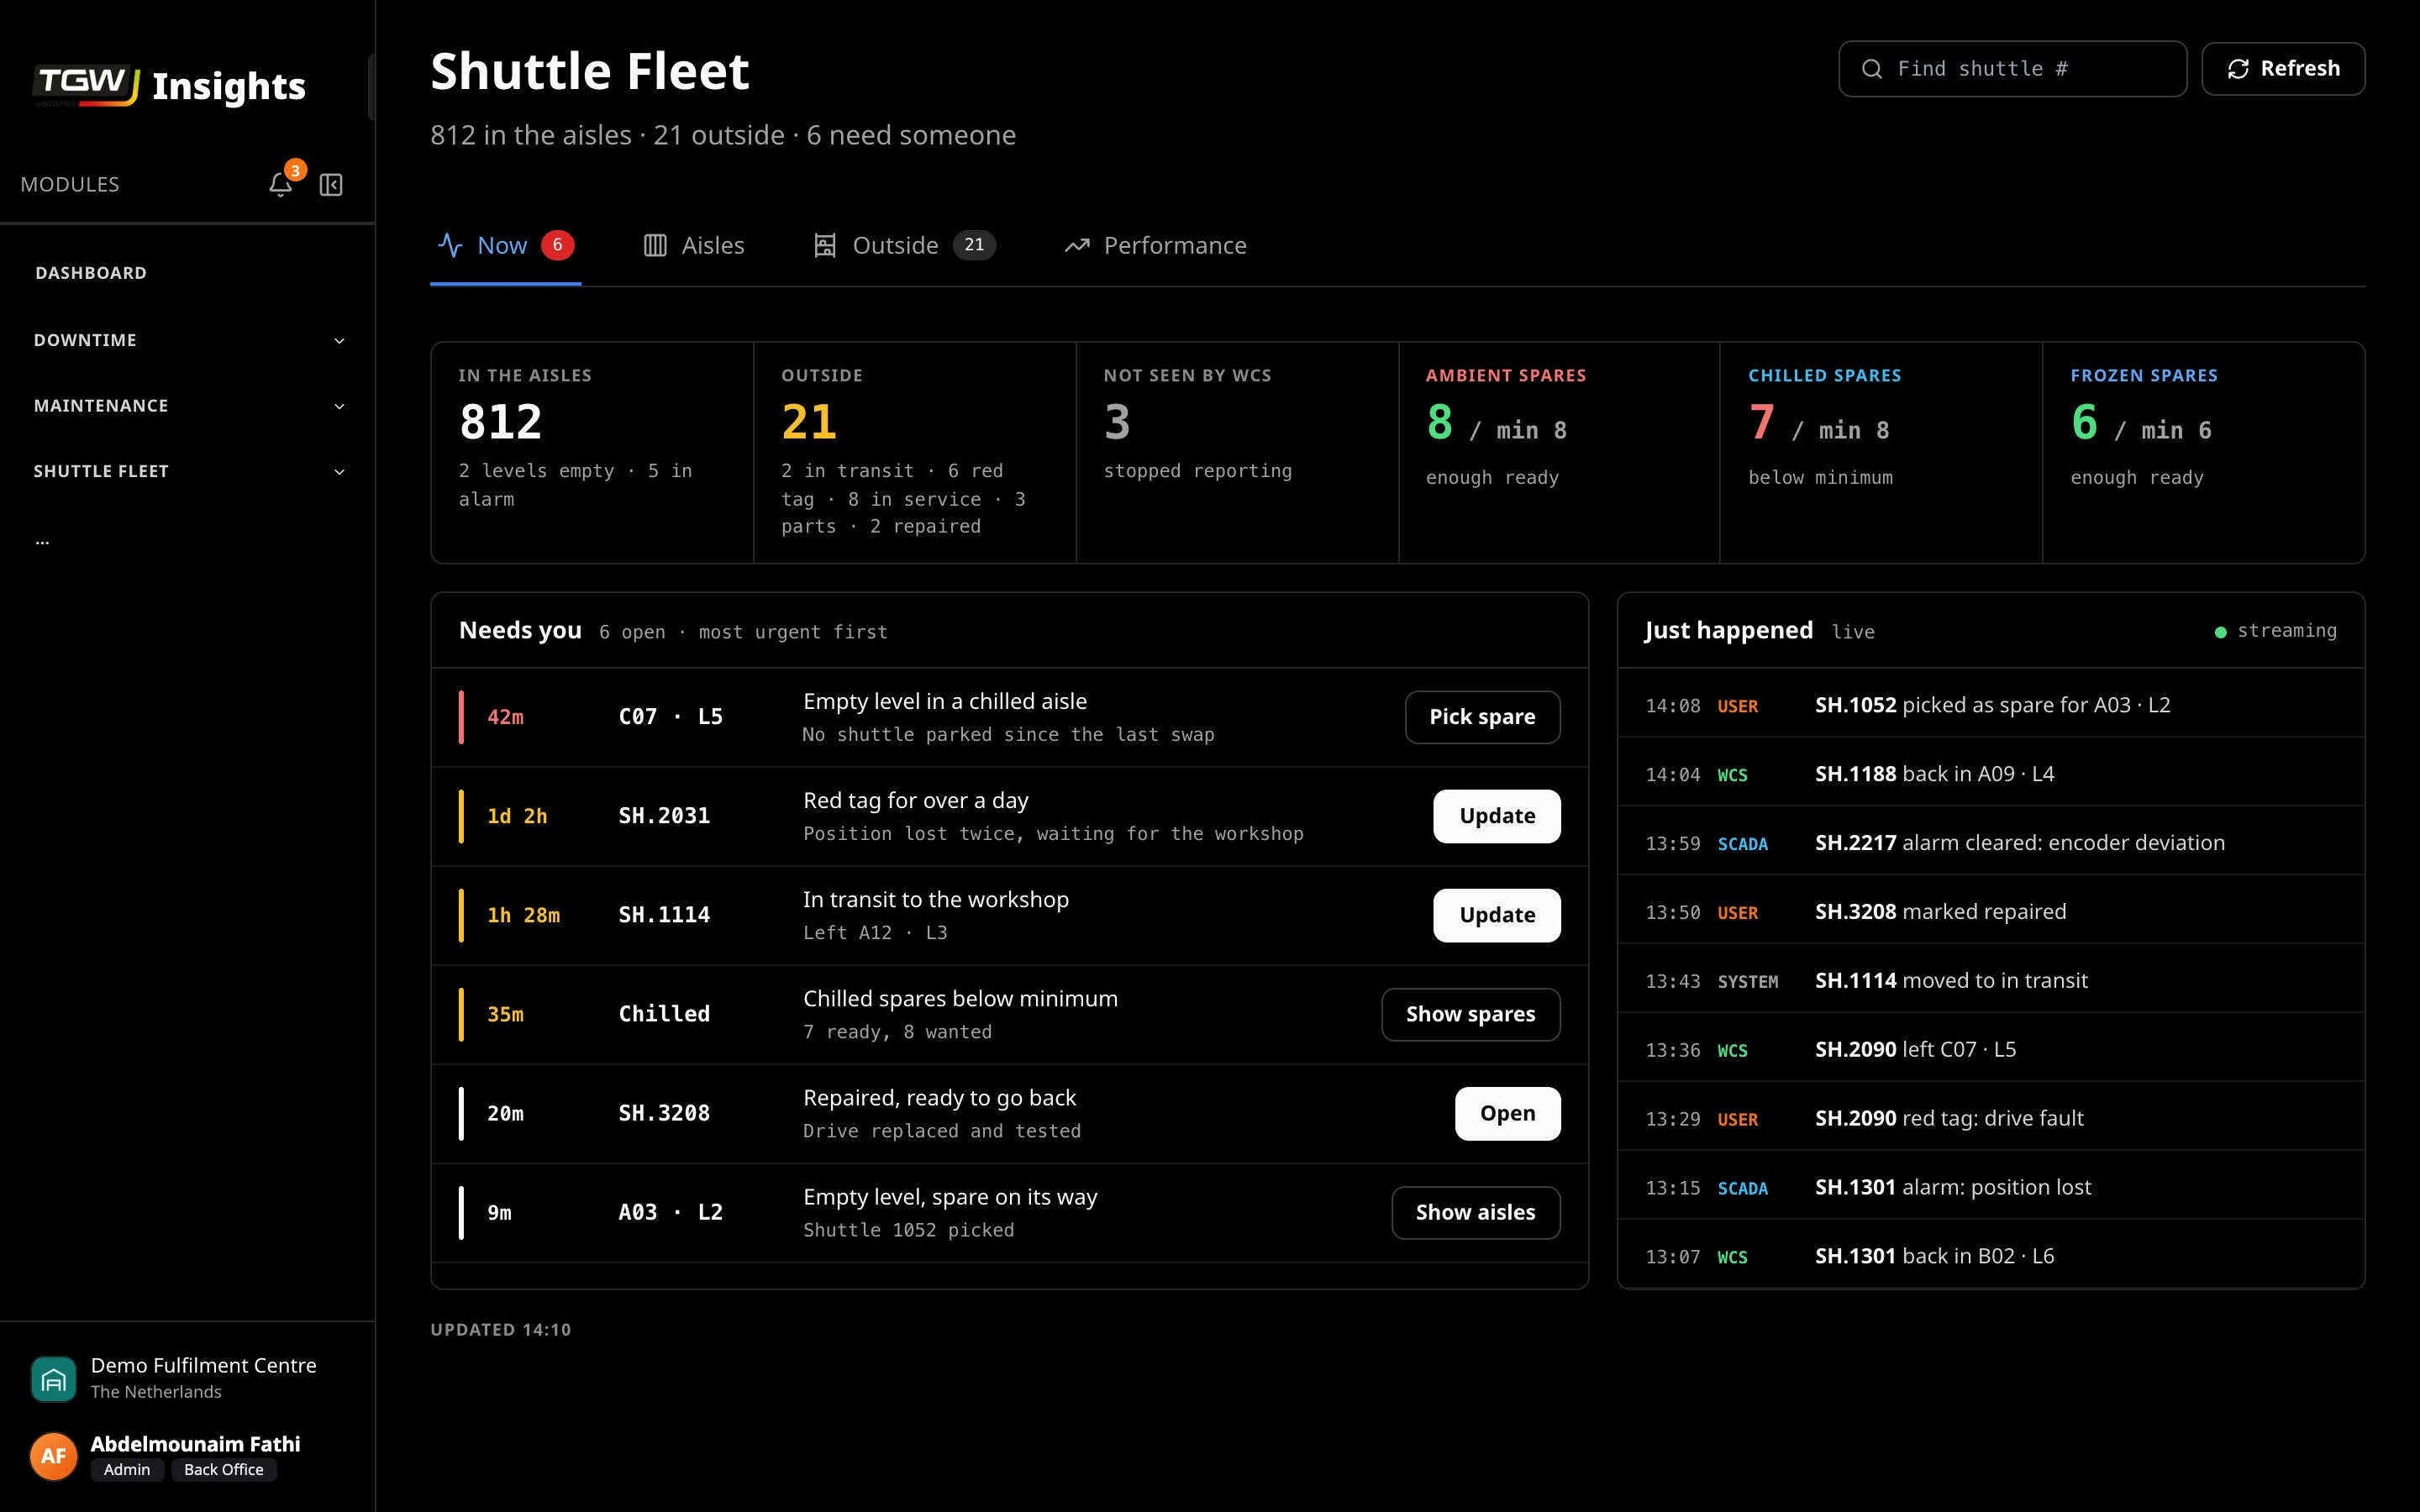
Parts and deliveries
It covers stock, order suggestions, receiving and labels, down to the shelf a part sits on.
Shift handover
What the next shift needs to know arrives in one stream instead of loose notes.
Alerts in Teams
Build your own alert recipes, and they arrive where the team already talks.
Built with
Self-hosted, inside the plant.
- Next.js
- React
- TypeScript
- PostgreSQL
- Prisma
- Docker
- OpenTelemetry
- Grafana
- Modular architecture
- Live data feeds
- Scheduled jobs
- Passkey sign-in
- Role-based access
- Teams alerts
- Encrypted backups
- Tracing, metrics and logs
11
modules in one app
145
pages
60–70
people using it
Design
What happened, where, and what to do about it.
Written for the floor
The systems underneath hold the kind of detail an analyst wants. Every screen turns it into what happened, where it happened, and what to do next.
Everything points at the equipment
An alarm, a task, a part and a handover note all hang off the same machine, so its full picture is never more than a click or two away.
One shell, eleven modules
Every module sits in the same frame, so a technician who learns one page already knows the other ten.
Real Insights screens, shown with anonymised data.